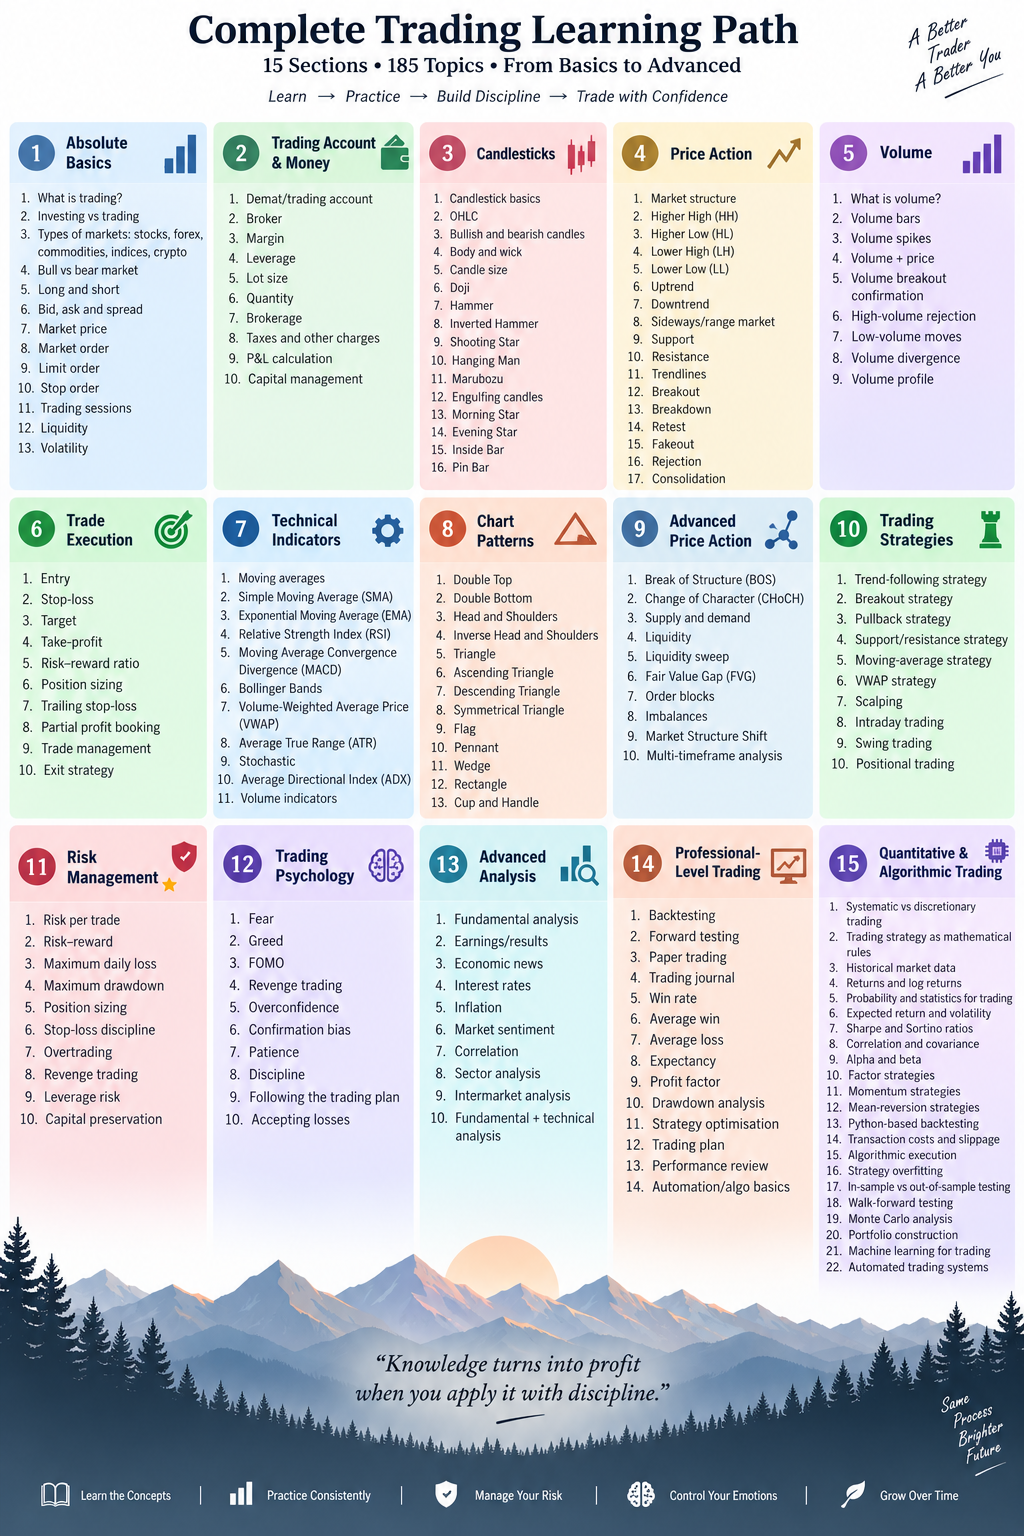
Trading can look deceptively simple from the outside: buy something, wait for the price to rise, and sell it for a profit.
In reality, becoming a competent trader requires understanding markets, price behaviour, risk, probability, psychology and execution. For those interested in quantitative trading, the journey eventually extends into statistics, programming, backtesting and machine learning.
The real difficulty is knowing what to learn, in what order.
This guide provides a structured 15-section trading roadmap, beginning with the absolute fundamentals and progressing towards professional, quantitative and algorithmic trading.
The Complete Trading Learning Roadmap
A sensible progression is:
Market Basics → Money → Candlesticks → Price Action → Volume → Execution → Indicators → Chart Patterns → Advanced Price Action → Strategies → Risk Management → Psychology → Fundamental Analysis → Professional Trading → Quantitative & Algorithmic Trading
The important idea is progression.
Do not begin by searching for the “best trading strategy”. First understand the machinery of the market in which that strategy operates.
1. Learn the Absolute Basics of Trading
Before analysing charts, understand what trading actually means.
Trading involves buying or selling a financial instrument with the intention of benefiting from changes in its price.
Start with:
- What is trading?
- Investing vs trading
- Stocks, forex, commodities, indices and crypto
- Bull and bear markets
- Long and short positions
- Bid, ask and spread
- Market price
- Market orders
- Limit orders
- Stop orders
- Trading sessions
- Liquidity
- Volatility
Trading vs Investing
The distinction is particularly important.
An investor generally attempts to benefit from the long-term growth or income-generating ability of an asset.
A trader generally attempts to benefit from price movements over a shorter or explicitly defined horizon.
Neither is inherently superior. They are different approaches to deploying capital.
Before asking:
“Should I buy this?”
A trader should learn to ask:
“What is my thesis, where is my entry, where am I wrong, and how much am I prepared to lose?”
That shift in thinking becomes increasingly important as you progress.
2. Understand Trading Accounts and Money
Charts are only one side of trading. The other side is capital.
Learn:
- Demat and trading accounts
- Brokers
- Margin
- Leverage
- Lot size
- Quantity
- Brokerage
- Taxes and charges
- Profit and loss calculations
- Capital management
Why Leverage Matters
Suppose you have £10,000 but use leverage to control a position worth £50,000.
Your economic exposure is no longer merely £10,000.
If the position moves 2% against you:
Loss = £50,000 × 2% = £1,000
That represents 10% of your original £10,000 capital.
Leverage magnifies gains, but it also magnifies losses. This is why understanding leverage should come before experimenting with leveraged strategies.
3. Learn Candlestick Charts
Candlesticks are a visual representation of price behaviour during a specified period.
Every standard candle contains four important prices:
Open — High — Low — Close (OHLC)
Learn:
- Candlestick basics
- OHLC
- Bullish and bearish candles
- Candle bodies and wicks
- Candle size
- Doji
- Hammer
- Inverted Hammer
- Shooting Star
- Hanging Man
- Marubozu
- Engulfing candles
- Morning Star
- Evening Star
- Inside Bar
- Pin Bar
But avoid memorising candlestick patterns as isolated signals.
A hammer appearing randomly in a chart is considerably less informative than a hammer appearing around an important price level after a substantial decline.
Context matters more than the name of the candle.
4. Master Price Action and Market Structure
This is where charts begin to tell a story.
Learn how price moves through:
- Higher Highs (HH)
- Higher Lows (HL)
- Lower Highs (LH)
- Lower Lows (LL)
A simplified bullish structure might look like:
HL → HH → HL → HH → HL → HH
A bearish structure might look like:
LH → LL → LH → LL → LH → LL
From here, study:
- Uptrends
- Downtrends
- Range-bound markets
- Support
- Resistance
- Trendlines
- Breakouts
- Breakdowns
- Retests
- Fakeouts
- Rejections
- Consolidation
Price action helps answer one of trading’s most fundamental questions:
Who currently appears to have greater control — buyers or sellers?
5. Understand Volume
Price tells you where the market moved.
Volume provides information about how much trading activity accompanied that move.
Study:
- Volume
- Volume bars
- Volume spikes
- Price-volume relationships
- Breakout confirmation
- High-volume rejection
- Low-volume moves
- Volume divergence
- Volume profile
Consider a resistance level.
If price breaks above resistance with unusually strong participation, traders may interpret the move differently from a small move above resistance on weak activity.
Volume therefore provides another dimension for evaluating price behaviour.
6. Learn How to Execute a Trade
Identifying an opportunity is not the same as managing a trade.
Every trade should ideally answer three questions before execution:
Where do I enter?
Where do I exit if I am wrong?
Where might I take profit if I am right?
Study:
- Entry
- Stop-loss
- Target
- Take-profit
- Risk–reward ratio
- Position sizing
- Trailing stops
- Partial profit booking
- Trade management
- Exit strategies
A trader without an exit framework can turn a manageable loss into a large one simply by refusing to accept that the original thesis has failed.
7. Learn Technical Indicators
Once price itself is understood, indicators become more useful.
Study:
- Moving averages
- SMA
- EMA
- RSI
- MACD
- Bollinger Bands
- VWAP
- ATR
- Stochastic
- ADX
- Volume indicators
Indicators should generally be viewed as transformations of market data, rather than magical predictors.
For example, a moving average summarises historical prices. RSI mathematically transforms recent price changes into a bounded momentum measure.
The indicator is derived from the market.
Understanding that relationship prevents indicators from becoming a substitute for reasoning.
8. Study Chart Patterns
Market behaviour sometimes creates recurring geometric structures.
Important patterns include:
- Double Top
- Double Bottom
- Head and Shoulders
- Inverse Head and Shoulders
- Triangles
- Ascending Triangle
- Descending Triangle
- Symmetrical Triangle
- Flag
- Pennant
- Wedge
- Rectangle
- Cup and Handle
Do not think:
Pattern = guaranteed outcome
Think:
Pattern = a hypothesis about market behaviour that needs confirmation and risk control.
Trading deals with probabilities, not certainties.
9. Move Into Advanced Price Action
Once basic structure becomes intuitive, more sophisticated price-action concepts become easier to understand.
Study:
- Break of Structure (BOS)
- Change of Character (CHoCH)
- Supply and demand
- Liquidity
- Liquidity sweeps
- Fair Value Gaps (FVG)
- Order blocks
- Imbalances
- Market Structure Shifts
- Multi-timeframe analysis
A particularly useful concept here is liquidity.
Markets require counterparties. Areas containing clusters of orders can therefore become important parts of price behaviour.
However, terminology such as FVGs, liquidity sweeps and order blocks should not be treated as unquestionable laws. They are frameworks traders use to interpret price behaviour, and their usefulness should ultimately be tested.
10. Build Trading Strategies
Only after learning the underlying components should you begin combining them into strategies.
Explore:
- Trend-following
- Breakout trading
- Pullback trading
- Support/resistance strategies
- Moving-average strategies
- VWAP strategies
- Scalping
- Intraday trading
- Swing trading
- Positional trading
A strategy should eventually become more precise than:
“This chart looks bullish.”
A systematic strategy might instead specify:
Market condition → Setup → Entry → Stop → Position size → Exit → Risk limit
The more clearly the rules are defined, the easier the strategy becomes to evaluate objectively.
11. Master Risk Management
This may be the most important section of the entire roadmap.
Study:
- Risk per trade
- Risk–reward ratio
- Maximum daily loss
- Maximum drawdown
- Position sizing
- Stop-loss discipline
- Overtrading
- Revenge trading
- Leverage risk
- Capital preservation
Consider two traders.
Trader A is excellent at predicting markets but repeatedly risks enormous amounts.
Trader B has a modest strategy but controls losses carefully.
Over a sufficiently long period, survival itself becomes a competitive advantage.
The first responsibility of a trader is therefore not necessarily:
“Make as much money as possible.”
It is:
“Avoid taking risks capable of removing me from the game.”
12. Understand Trading Psychology
A perfectly reasonable strategy can be destroyed by inconsistent execution.
Trading exposes several psychological tendencies:
- Fear
- Greed
- FOMO
- Revenge trading
- Overconfidence
- Confirmation bias
- Impatience
- Lack of discipline
- Abandoning the trading plan
- Refusing to accept losses
Suppose your system generates five consecutive losses.
You abandon it.
The following three trades would have been profitable.
You return.
Another loss occurs.
You increase your position size to recover previous losses.
At this point, the problem may no longer be the trading strategy.
It may be the trader’s behaviour.
Professional development therefore requires learning to separate process quality from the outcome of an individual trade.
13. Combine Technical and Fundamental Analysis
Charts do not exist independently of the economy.
Learn:
- Fundamental analysis
- Company earnings and results
- Economic news
- Interest rates
- Inflation
- Market sentiment
- Correlation
- Sector analysis
- Intermarket analysis
- Combining fundamental and technical analysis
Interest rates, inflation expectations, economic growth, company profitability and market positioning can all influence asset prices.
A mature trader therefore develops multiple ways of interpreting the market rather than depending entirely on one indicator.
14. Think Like a Professional Trader
Now the question changes.
Instead of:
“Did this trade make money?”
Ask:
“Does this process have a repeatable statistical advantage?”
Study:
- Backtesting
- Forward testing
- Paper trading
- Trading journals
- Win rate
- Average win
- Average loss
- Expectancy
- Profit factor
- Drawdown analysis
- Strategy optimisation
- Trading plans
- Performance reviews
- Automation basics
Trading Expectancy
A useful concept is expectancy:
Expectancy = (Probability of Win × Average Win) − (Probability of Loss × Average Loss)
Suppose:
Win rate = 45%
Average win = £200
Average loss = £100
Then:
Expectancy = (0.45 × £200) − (0.55 × £100)
= £90 − £55
= £35 per trade
This illustrates an important lesson:
A profitable strategy does not necessarily require winning most trades.
The relationship between wins, losses and their respective sizes matters.
15. Enter Quantitative and Algorithmic Trading
This is where trading increasingly intersects with mathematics, statistics, computer science and AI.
Study:
- Systematic vs discretionary trading
- Strategies expressed as mathematical rules
- Historical market data
- Returns and log returns
- Probability and statistics
- Expected return
- Volatility
- Sharpe ratio
- Sortino ratio
- Correlation
- Covariance
- Alpha
- Beta
- Factor strategies
- Momentum
- Mean reversion
- Python backtesting
- Transaction costs
- Slippage
- Algorithmic execution
- Strategy overfitting
- In-sample testing
- Out-of-sample testing
- Walk-forward testing
- Monte Carlo analysis
- Portfolio construction
- Machine learning for trading
- Automated trading systems
This section is particularly important for programmers, data scientists and AI engineers.
A trading idea can increasingly be expressed as:
Hypothesis → Data → Mathematical Rules → Backtest → Validation → Risk Model → Execution → Monitoring
At this stage, Python, statistics and machine learning become powerful tools.
But technology cannot rescue a fundamentally poor trading hypothesis.
A sophisticated neural network trained on noisy data can still produce a sophisticated way of losing money.
From Beginner Trader to Quantitative Trader
The complete journey can be thought of as five stages:
Stage 1 — Understand the Market
Learn instruments, prices, orders, liquidity and volatility.
Stage 2 — Learn to Read the Market
Study candlesticks, structure, price action, volume and technical indicators.
Stage 3 — Learn to Trade the Market
Develop entries, exits, strategies, position sizing and risk controls.
Stage 4 — Learn to Measure Yourself
Use journals, backtesting, expectancy, drawdown analysis and performance reviews.
Stage 5 — Learn to Model the Market
Move towards probability, statistics, Python, systematic strategies, portfolio construction, machine learning and automated execution.
Final Thoughts
Trading education should not begin with the question:
“Which indicator will make me money?”
A better sequence of questions is:
What am I trading?
Why does its price move?
How will I identify an opportunity?
How much will I risk?
What evidence suggests my strategy has an edge?
How will I know when that edge has disappeared?
That progression transforms trading from speculation based primarily on intuition into a discipline centred on probability, risk and repeatable decision-making.
And that is the real progression:
Learn the market → Read the market → Manage risk → Test your ideas → Measure performance → Automate only what works.
Deeper -lets dive into each chapter
Section 1 — Absolute Basics of Trading
The goal of this section is to understand what actually happens when you trade. We will keep the concepts practical and use simple examples.
1. What is Trading?
Trading is buying or selling a financial asset with the aim of making a profit from changes in its price.
Suppose a share is trading at £100.
You believe its price will increase, so you buy it.
Buy: £100
Sell later: £110
Profit: £10 per share
If instead it falls to £95 and you sell:
Loss: £5 per share.
So, at its simplest:
Trading = taking a position on future price movement.
Importantly, trading does not guarantee profit. The future price is uncertain.
2. Investing vs Trading
Both involve putting capital into financial assets, but the objectives and time horizons are usually different.
| Trading | Investing |
|---|---|
| Usually shorter-term | Usually longer-term |
| Focuses heavily on price movements | Focuses heavily on long-term value/growth |
| Minutes, hours, days, months | Often years |
| More frequent transactions | Usually fewer transactions |
| Technical analysis often important | Fundamental analysis often important |
| Example: buying at £100 to sell at £110 | Buying at £100 and holding for 10 years |
Think of it this way:
Investor:
“Is this company likely to become substantially more valuable over the next 10 years?”
Trader:
“What is the probable direction of this price, and where should I enter and exit?”
The boundary isn’t absolute. A person can be both an investor and a trader.
3. What Can We Trade?
There are several major financial markets.
A. Stocks
A stock/share represents ownership in a company.
Examples include shares of companies such as Apple, Microsoft or Tesco.
If you buy 100 shares at £20:
Position value = 100 × £20 = £2,000
If the share reaches £22:
Profit = (£22 − £20) × 100 = £200
before fees and taxes.
B. Forex
Forex = Foreign Exchange.
You trade one currency relative to another.
Examples:
- EUR/USD
- GBP/USD
- USD/JPY
Suppose:
GBP/USD = 1.30
Very roughly, this means:
£1 = $1.30
If you expect GBP to strengthen relative to USD, you might take a position accordingly.
Forex is therefore about the relative value of two currencies.
C. Commodities
Commodities are physical resources or raw materials.
Examples:
- Gold
- Silver
- Crude oil
- Natural gas
- Wheat
- Coffee
Traders commonly gain exposure through derivatives such as futures rather than physically buying barrels of oil or storing tonnes of wheat.
D. Indices
An index measures the performance of a group of securities.
Examples include:
- FTSE 100
- S&P 500
- Nasdaq-100
- DAX
For example, the FTSE 100 represents a basket of major companies listed on the London Stock Exchange.
You don’t normally “buy the index itself”. Exposure can be obtained through products such as ETFs, futures and other derivatives.
E. Crypto
Cryptocurrencies are digital assets.
Examples:
- Bitcoin
- Ether
Crypto markets can be highly volatile and trade around the clock on many venues.
So our first map is:
Financial Markets
→ Stocks
→ Forex
→ Commodities
→ Indices
→ Crypto
4. Bull and Bear Markets
These describe the broad direction or sentiment of a market.
🐂 Bull Market
A bull market describes a market experiencing a sustained upward trend.
For example:
100 → 110 → 125 → 140 → 155 ↑
Prices are generally rising.
You will often hear:
“I’m bullish on gold.”
It means the person expects gold’s price to rise.
🐻 Bear Market
A bear market describes a market experiencing a sustained downward trend.
155 → 140 → 125 → 110 → 95 ↓
Someone saying:
“I’m bearish on the stock.”
means they expect its price to decline.
A useful memory trick:
Bull = ↑
Bear = ↓
5. Long and Short Positions
This is one of the most important concepts in trading.
LONG
You go long when you take a position that benefits if the asset’s price rises.
For example:
Buy at £100
Price rises to £120.
Profit = £20
So:
LONG → Want price ↑
SHORT
A short position benefits when the price falls.
Simplified example:
You short at:
£100
Price subsequently falls to:
£80
Ignoring costs and mechanics:
Profit = £100 − £80 = £20
So:
SHORT → Want price ↓
Actual short selling usually involves borrowing securities and later buying them back. Derivatives can provide short exposure differently.
One crucial difference is risk.
A long position in an unleveraged stock cannot fall below zero, so the loss on the stock itself is bounded.
A short seller’s theoretical loss can be unlimited, because there is theoretically no upper limit to how high a share price can rise.
6. Bid, Ask and Spread
Suppose you see:
Bid: £99.90
Ask: £100.00
Bid
The bid is the highest price a buyer is currently willing to pay.
Ask
The ask is the lowest price a seller is currently willing to accept.
Spread
The difference is the bid-ask spread.
Spread = Ask − Bid
Therefore:
£100.00 − £99.90 = £0.10
Visually:
Buyer ← £99.90 | £0.10 spread | £100.00 → Seller
Generally, highly liquid markets tend to have tighter spreads, although spreads can widen dramatically during volatile periods.
7. Market Price
The market price is the price at which an asset is currently trading, though exactly what a platform displays can vary—it may show the last traded price, bid, ask, or another reference price.
Suppose transactions occur around:
£99.98 → £100.00 → £100.02
The displayed market price might be around £100.
But remember the previous concept:
Displayed price does not necessarily mean you can buy or sell unlimited quantities at exactly that price.
That becomes important when we study liquidity.
8. Market Order
A market order tells the broker to execute your order immediately at the best available price.
Suppose the current ask is approximately:
£100
You submit:
Buy 100 shares at market.
You are prioritising:
Execution certainty
rather than:
Price certainty
You might expect £100 but actually receive fills such as:
£100.01, £100.03 or £100.05
depending on liquidity and how quickly the market is moving.
This difference is related to slippage.
9. Limit Order
A limit order specifies the maximum price you are willing to pay when buying, or the minimum price you’re willing to accept when selling.
Current price:
£100
You think £100 is too expensive.
You place:
Buy Limit = £95
Your instruction is essentially:
“Buy at £95 or better.”
If price falls:
£100 → £98 → £96 → £95
your order may execute.
But if price goes:
£100 → £105 → £110
your £95 buy limit will not execute.
Therefore:
Market order → prioritises execution
Limit order → prioritises price
A limit order is not guaranteed to execute.
10. Stop Order
A stop order becomes active when a specified stop price is reached or crossed.
For example, suppose a stock trades at:
£100
You believe that if it breaks above £105, a stronger upward move may begin.
You could place a:
Buy Stop = £105
If the trigger condition is reached, the order activates according to the stop-order type.
Stop orders are also commonly associated with stop-losses.
For example:
Buy: £100
Stop-loss trigger: £95
If the market falls sufficiently, the stop is intended to get you out and limit further loss.
However, an ordinary stop-market order does not guarantee execution exactly at £95. A fast-moving or gapping market can result in a worse execution price.
11. Trading Sessions
Different financial markets operate at different times.
Stock exchanges have defined trading hours.
For example, major market centres include:
Asia → London/Europe → New York
Forex activity is commonly described using sessions such as:
- Sydney
- Tokyo
- London
- New York
Forex trades nearly 24 hours a day during the working week because trading activity moves between global financial centres.
Crypto is different again.
Many cryptocurrency markets operate:
24 hours × 7 days
Why do sessions matter?
Because liquidity, volatility and trading activity can change throughout the day.
12. Liquidity
Liquidity describes how easily an asset can be bought or sold in meaningful size without causing a large change in its price.
Imagine Stock A:
Bid £99.99 | Ask £100.00
There are thousands of buyers and sellers.
Now imagine Stock B:
Bid £95 | Ask £105
and very few participants.
Stock A is likely considerably more liquid.
High liquidity generally means:
More participants → deeper order book → easier execution → usually tighter spreads
Low liquidity can mean:
Fewer participants → wider spreads → more slippage → potentially difficult execution
Liquidity becomes extremely important once we study professional and algorithmic trading.
13. Volatility
Volatility describes the magnitude and variability of price movements.
Consider two assets.
Asset A
£100 → £100.50 → £99.80 → £100.30 → £100
Small movements.
Asset B
£100 → £115 → £91 → £120 → £85
Large movements.
Asset B has much higher volatility.
Volatility is not the same thing as direction.
A market can be:
Volatile and rising
or
Volatile and falling
or even
Volatile but ultimately going nowhere.
This distinction becomes very important later when we study ATR, options, risk management, position sizing and quantitative trading.
Putting Section 1 Together
Imagine a stock is trading at:
Bid: £99.90
Ask: £100.00
You are bullish, so you expect the price to rise.
You decide to go long.
You could submit a market order and buy near the best available ask.
Or you could place a limit order at £98, hoping for a cheaper entry.
Suppose you buy 100 shares at £100.
The stock rises to £110.
Your gross P&L is:
100 × (£110 − £100) = £1,000
If instead it falls to £95:
100 × (£95 − £100) = −£500
Now we can see how the concepts connect:
Market → Price → Bid/Ask → Order → Position → Price Movement → P&L
That is the foundation of trading.
Section 1 Mental Model
Trading is taking controlled financial exposure to uncertain price movements.
And four concepts should already be very clear:
Long → profit from ↑
Short → profit from ↓
Liquidity → ease of trading
Volatility → magnitude/variability of movement