This analysis is for finding a click event of the user, the details are as :
Zbay is an E-commerce website which sells a variety of products at its online platform. Zbay records user behaviour of its customers and stores it as a log. However, most of the times, users do not buy the products instantly and there is a time gap during which the customer might surf the internet and maybe visit competitor websites.
Now, to improve sales of products, Zbay has hired Adiza, an Adtech company which built a system such that ads are being shown for Zbay’s products on its partner websites.
If a user comes to Zbay’s website and searches for a product, and then visits these partner websites or apps, his/her previously viewed items or their similar items are shown on as an ad. If the user clicks this ad, he/she will be redirected to the Zbay’s website and might buy the product.
Load the basic libraries:
import pandas as pd
import numpy as np
import matplotlib.pyplot as plt
import seaborn as sns

from sklearn.preprocessing import LabelEncoder
The Train and Test samples look like:
dftrain=pd.read_csv('train.csv')
dftrainlog=pd.read_csv('view_log.csv')
dftrainitem=pd.read_csv('item_data.csv')
dftest=pd.read_csv('test.csv')
dftrain.head(3)
Output
dftrain.shape ————–>>>> (237609, 7)
| impression_id | impression_time | user_id | app_code | os_version | is_4G | is_click | |
|---|---|---|---|---|---|---|---|
| 0 | c4ca4238a0b923820dcc509a6f75849b | 2018-11-15 00:00:00 | 87862 | 422 | old | 0 | 0 |
| 1 | 45c48cce2e2d7fbdea1afc51c7c6ad26 | 2018-11-15 00:01:00 | 63410 | 467 | latest | 1 | 1 |
| 2 | 70efdf2ec9b086079795c442636b55fb | 2018-11-15 00:02:00 | 71748 | 259 | intermediate | 1 | 0 |
dftrainlog.head(2)
This table is having user-item mapping and its many to many.
| server_time | device_type | session_id | user_id | item_id | |
|---|---|---|---|---|---|
| 0 | 2018-10-15 08:58:00 | android | 112333 | 4557 | 32970 |
| 1 | 2018-10-15 08:58:00 | android | 503590 | 74788 | 7640 |
dftrainitem.head(3)
This table is having item price mapping and its one to one
| item_id | item_price | category_1 | category_2 | category_3 | product_type | |
|---|---|---|---|---|---|---|
| 0 | 26880 | 4602 | 11 | 35 | 20 | 3040 |
| 1 | 54939 | 3513 | 12 | 57 | 85 | 6822 |
| 2 | 40383 | 825 | 17 | 8 | 279 | 1619 |
The data volume is too high and we have to check the ratio of click and not clicked, and then make it in a balance like this,
df1=(dftrain[dftrain['is_click']==1])
df123=(dftrain[dftrain['is_click']==0])
df2=df123.iloc[:12000,:]
frames=[df1,df2]
dftrain=pd.concat(frames)
dftrain.shape  ----->>>> Output
(22862, 7)

          Total numer of rows      Ratio
is_click
0                       12000  52.488846
1                       10862  47.511154
Code for generating a pie chart:
def ShowPieChart(DataFrame,column1,column2):
     proportion=DataFrame.groupby(column1).count()[column2]
     col1=(((proportion)).sort_values(axis=0,ascending=False))
     total=proportion.sum()
     lstProportion=proportion/total
     col2=(((lstProportion*100)).sort_values(axis=0,ascending=False))
     plt.pie(lstProportion, autopct='%1.1f%%', shadow=False, startangle=140)
     plt.axis('equal')
     plt.show()
     dftemp=pd.DataFrame({'Total numer of rows':col1,'Ratio':col2})
     print(dftemp)
Now, we have to merge all the three tables to give a better meaning,before this we need to check and convert the data types into same data types. for this use following code:For Table1, ie, dftrain
convert_dict = {'impression_id': str,
                 'impression_time':str,
                 'user_id':str,
                 'app_code':str,
                 'os_version':str,
                 'is_4G':str,
                 'is_click':str
                }

dftrain = dftrain.astype(convert_dict)
for table 2, i.e dftrainlog,
convert_dict = {'server_time': str,
                 'device_type':str,
                 'session_id':str,
                 'user_id':str,
                 'item_id':str
                }
dftrainlog = dftrainlog.astype(convert_dict)
for table 3, dftrainitem
convert_dict = {'item_id': str,
                 'item_price':str,
                 'category_1':int,
                 'category_2':int,
                 'category_3':int,
                 'product_type':int
                }

dftrainitem = dftrainitem.astype(convert_dict)
Now, let’s check what we can do with a grouping of tables and check how many items users check.
dftrainloggroup=dftrainlog.groupby('user_id')['item_id'].agg([('count', 'count'), ('item_id', ', '.join)])

dftrainloggroup.reset_index('user_id',inplace=True)

dftrainloggroup.head(3)
| user_id | count | item_id | |
|---|---|---|---|
| 0 | 0 | 42 | 44459, 44459, 44459, 44459, 44459, 44459, 4022… |
| 1 | 1 | 8 | 64835, 27574, 22411, 91179, 126431, 67259, 409… |
| 2 | 10 | 92 | 88834, 8241, 59255, 82124, 98271, 26950, 11329… |
Now Merge the tables,
dftrainMerged=pd.merge(dftrain,dftrainloggroup[['user_id','count','item_id']],on='user_id',how='left')

dftrainMerged.shape

dftrainMerged.head(4)
| impression_id | impression_time | user_id | app_code | os_version | is_4G | is_click | count | item_id | |
|---|---|---|---|---|---|---|---|---|---|
| 0 | 45c48cce2e2d7fbdea1afc51c7c6ad26 | 2018-11-15 00:01:00 | 63410 | 467 | latest | 1 | 1 | 12 | 43209, 66370, 43209, 43209, 71877, 43209, 4320… |
| 1 | 43ec517d68b6edd3015b3edc9a11367b | 2018-11-15 00:06:00 | 74339 | 481 | old | 0 | 1 | 61 | 100847, 117590, 6131, 78766, 129770, 13924, 11… |
| 2 | 42998cf32d552343bc8e460416382dca | 2018-11-15 00:42:00 | 81926 | 249 | latest | 0 | 1 | 138 | 84085, 44104, 18653, 44104, 131433, 4907, 7615… |
| 3 | a9a1d5317a33ae8cef33961c34144f84 | 2018-11-15 00:57:00 | 8779 | 242 | latest | 1 | 1 | 29 | 49782, 49782, 45958, 90576, 90576, 107829, 991… |
Now, calculate the price of each item and minimum,max and average price that the user checks, for this we have used a function.
def getPriceItem(items):

    print(items)

    item_prices=[]

    exception_item=[]

    for item in items:

        try:

            price=int(dftrainitem[dftrainitem['item_id'] == item]['item_price'])

            item_prices.append(price)

        except:

            item_prices.append(0)

            print("Exception occured at ",item)

            exception_item.append(item)

            continue

    print('item_prices',item_prices)

    avg=np.mean(item_prices)

    minimum=min(item_prices)

    print('minimum',minimum)

    maximum=max(item_prices)

    return avg,minimum,maximum
lstavg=[]
lstminimum=[]
lstmaximum=[]
counter=0
for index,rows in dftrainMerged.iloc[:,:].iterrows():
     arrSplit=rows['item_id'].split(',')
     items=[str(i.strip()) for i in arrSplit]
     avg,minimum,maximum=getPriceItem(items)
     lstavg.append(avg)
     lstminimum.append(minimum)
     lstmaximum.append(maximum)
     print(counter)
     counter+=1
Then add the columns into the table,
dftrainMerged['AverageCost']=lstavg
dftrainMerged['MinCost']=lstminimum
dftrainMerged['MaxCost']=lstmaximum
Now, make a check Point and save the file,
dftrainMerged.to_csv('Merged.csv')
Now, load the file again and process the things further:
dftrain=pd.read_csv('Merged.csv')
Now, check the time of day click happened and day of month…
arrTimeOfDay=[]
 for i in dftrainMerged['impression_time']:
     tim=i
     hour=int((tim[11:]).split(':')[0])
     print(hour)
     if(hour<6):
         arrTimeOfDay.append(1)
     elif(hour<12):
         arrTimeOfDay.append(2)
     elif(hour<18):
         arrTimeOfDay.append(3)
     else:
         arrTimeOfDay.append(4)
dftrain['timeofDay']=arrTimeOfDay
arrDay=[]
for i in dftrainMerged['impression_time']:
     tim=i
     day=int((tim[8:10]).split(':')[0])
     print(day)
     arrDay.append(day)

dftrain['day']=arrDay
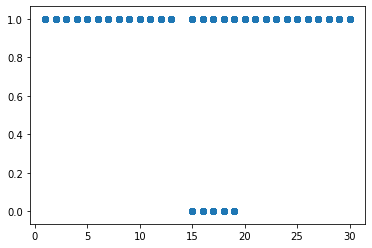
Now, check the data,
plt.scatter(dftrain['AverageCost'],dftrain['is_click'])

plt.scatter(dftrain[‘day’],dftrain[‘is_click’])
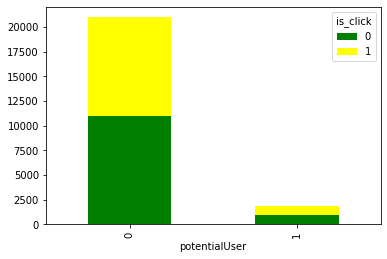
We can also add the potential user, who checks the website gaian and again..
arrpotentialuser=dftrain[dftrain['user_id'].duplicated()]['user_id']

lstpotential=[]
for i,j in dftrain.iterrows():
     #print(user)
     if(j['user_id'] in arrpotentialuser):
         lstpotential.append(1)
     else:
         lstpotential.append(0)
dftrain['potentialUser']=lstpotential
potuser = pd.crosstab(dftrain['potentialUser'], dftrain['is_click'])
print(potuser)

potuser.plot(kind='bar', stacked=True, color=['green','yellow'], grid=False)
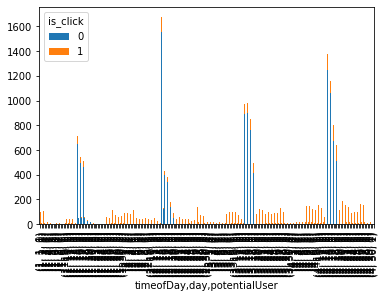
temp3 = pd.crosstab([dftrain['timeofDay'],dftrain['day'],dftrain["potentialUser"]],dftrain['is_click'])
temp3.plot(kind="bar",stacked=True)
plt.show()
convert required columns to numeric using label encoder,
var_mod = ['os_version']
le = LabelEncoder()
for i in var_mod:
     dftrain[i] = le.fit_transform(dftrain[i])
dftrain.dtypes
#Rearrange the column positions
cols=['impression_id', 'impression_time', 'user_id', 'app_code','os_version', 'is_4G', 'count', 'item_id', 'AverageCost','MinCost', 'MaxCost', 'timeofDay', 'day', 'potentialUser','is_click']
dftrain=dftrain[cols]
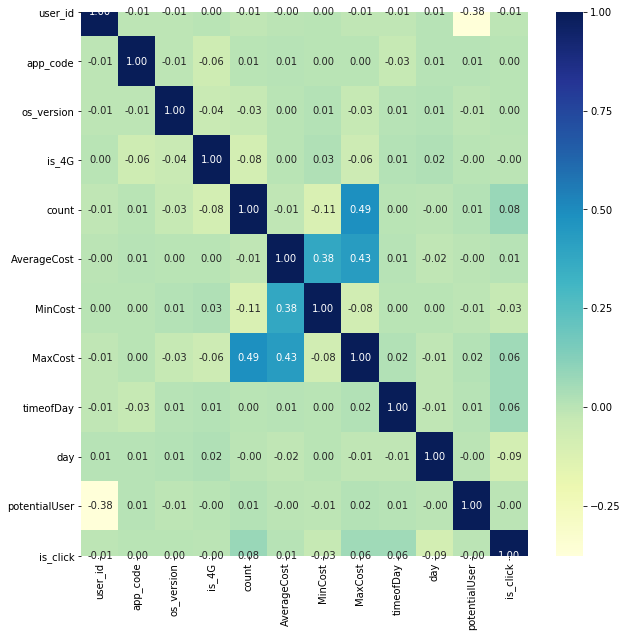
print("===============================Correlation of categorical values=====================")
plt.figure(figsize=[10,10])
corr=dftrain.corr()
sns.heatmap(corr, annot=True, fmt=".2f",cmap="YlGnBu")
plt.show()
=========Correlation of categorical values============
I just like the valuable information you provide on your articles. I will bookmark your weblog and test once more here regularly. I am moderately certain I’ll learn a lot of new stuff proper right here! Good luck for the next!
Hi there! This post couldn’t be written any better! Reading through this post reminds me of my previous room mate! He always kept talking about this. I will forward this article to him. Pretty sure he will have a good read. Thank you for sharing!
It’s amazing to go to see this web site and reading the views of all mates concerning this piece of writing,
while I am also keen of getting familiarity.