Now a days 3d transformation is required in neuroscience in order to visualize the material, even we are proceeding towards the cosmos and try to visualize the object in a 3d space. This article is based on the visualization technique.
With Deep Learning we have achieved a lot of progress in the process of conversion, Deep learning methods can be divided into two classes: single network-based and multiple networks based.
“Sun et al”, estimated the locations of5facial landmarks using Cascaded Convolutional Neural Networks (CascadedCNN), in which each level computes averaged estimated shape and the shape is refined level by level.
“Zhou et al” used multi-level deep networks to detect facial landmarks from coarse to fine. Similarly, Zhang et al. [10] proposed Coarse-to-Fine Auto-encoder Networks (CFAN).
Lets have a look into the code:
Load Basic libraries:
import face_alignment
from skimage import io
import matplotlib.pyplot as plt
import collections
fa2D = face_alignment.FaceAlignment(face_alignment.LandmarksType._2D, flip_input=False,device='cpu')
or
fa3D = face_alignment.FaceAlignment(face_alignment.LandmarksType._3D, flip_input=False,device='cpu')
Now load the land marks to 2d or from 3d
input_img = io.imread('face1.jpg')
preds = fa.get_landmarks(input_img)[-1]
or
preds = fa3D.get_landmarks(input_img)[-1]
Now, keep a list of markers where the point lie,
input_img = io.imread('face1.jpg')
preds = fa.get_landmarks(input_img)[-1]
or
preds = fa3D.get_landmarks(input_img)[-1]
plot_style = dict(marker='o',
markersize=4,
linestyle='-',
lw=2)plot_style = dict(marker='o',
markersize=4,
linestyle='-',
lw=2)
pred_type = collections.namedtuple('prediction_type', ['slice', 'color'])
pred_types = {'face': pred_type(slice(0, 17), (0.682, 0.780, 0.909, 0.5)),
'eyebrow1': pred_type(slice(17, 22), (1.0, 0.498, 0.055, 0.4)),
'eyebrow2': pred_type(slice(22, 27), (1.0, 0.498, 0.055, 0.4)),
'nose': pred_type(slice(27, 31), (0.345, 0.239, 0.443, 0.4)),
'nostril': pred_type(slice(31, 36), (0.345, 0.239, 0.443, 0.4)),
'eye1': pred_type(slice(36, 42), (0.596, 0.875, 0.541, 0.3)),
'eye2': pred_type(slice(42, 48), (0.596, 0.875, 0.541, 0.3)),
'lips': pred_type(slice(48, 60), (0.596, 0.875, 0.541, 0.3)),
'teeth': pred_type(slice(60, 68), (0.596, 0.875, 0.541, 0.4))
}fig = plt.figure(figsize=plt.figaspect(.5))
ax = fig.add_subplot(1, 2, 1)
ax.imshow(input_img)
for pred_type in pred_types.values():
print()
ax.plot(preds[pred_type.slice, 0],preds[pred_type.slice, 1],color=pred_type.color, **plot_style)
ax.axis('off')
#ax.figure(figsize=(10,10))
# 3D-Plot
ax = fig.add_subplot(1, 2, 2, projection='3d')
surf = ax.scatter(preds[:, 0] * 1.2,
preds[:, 1],
#preds[:, 2],
c='cyan',
alpha=1.0,
edgecolor='b')
for pred_type in pred_types.values():
ax.plot3D(preds[pred_type.slice, 0] * 1.2,
preds[pred_type.slice, 1],
#preds[pred_type.slice, 2],
color='blue')
ax.view_init(elev=90., azim=90.)
ax.set_xlim(ax.get_xlim()[::-1])
plt.show()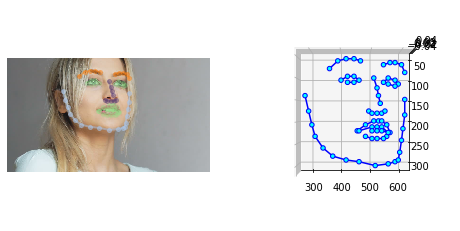
from mpl_toolkits.mplot3d import Axes3D
Axes3D = Axes3D
fig = plt.figure(figsize=(8,8))
ax= fig.add_subplot(111,projection='3d')
xs=[i[1] for i in preds[:]]
ys=[i[0] for i in preds[:]]
zs=[i[2] for i in preds[:]]
#ax.scatter(xs,ys,zs,s=200,alpha=0.6,edgecolors='w')
surf = ax.scatter(xs ,
                 ys,
                  s=50,
                  edgecolors='w',
                  c='cyan',
                  alpha=1.0,
                  edgecolor='b')
ax.plot3D(xs,
              ys,zs,
              #preds[pred_type.slice, 2],
              color='blue')
ax.view_init(elev=81., azim=182.)
ax.set_xlim(ax.get_xlim()[::-1])
plt.show() 
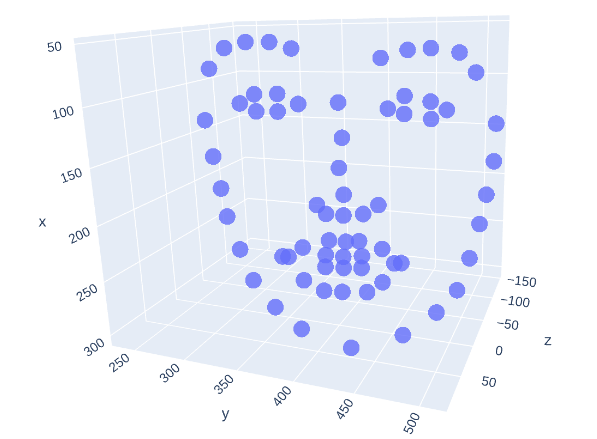
import plotly.graph_objects as go
import numpy as np

fig = go.Figure(data=[go.Scatter3d(
    x=xs,
    y=ys,
    z=zs,
    mode='markers',
    marker=dict(
        size=5,
        colorscale='Viridis',   # choose a colorscale
        opacity=0.8
    )
)])
fig.update_layout(margin=dict(l=0, r=0, b=0, t=0))
fig.show()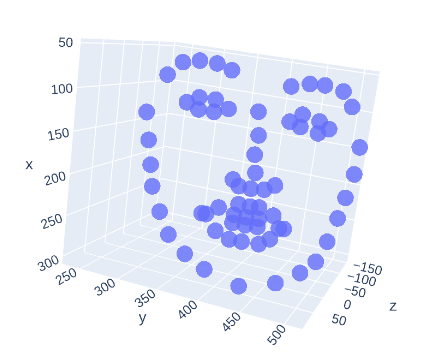
We can see the published papers on this with leader boards,
https://paperswithcode.com/task/face-alignment/latest?page=2
Very informative 👍👍
There are some attention-grabbing time limits in this article but I don’t know if I see all of them middle to heart. There’s some validity but I will take hold opinion until I look into it further. Good article , thanks and we wish extra! Added to FeedBurner as effectively
Awesome post! Keep up the great work! 🙂
Great content! Super high-quality! Keep it up! 🙂