Many times we need to visualize our model on Tensorboard, for this we have to save our model and at runtime check out the performance. Here is the code for a simple linear regression using Keras and tensorboard.
import Libraries:
import keras
import numpy as np
from pandas import read_csv
from keras.models import Sequential
from keras.layers import Dense
from keras.wrappers.scikit_learn import KerasRegressor
from keras.callbacks import TensorBoard
Let’s take two lists of numbers,
X=np.array([1,2,3,4,5,6,7,8,9,10,12,11,22,21,21,12,12,8,7,5,4,6,7])
Y=np.array([1,2,3,4,5,6,8,8,9,10,13,11,22,21,21,10,12,8,7,5,4,5,7])
Create a neural network Model,
from keras.wrappers.scikit_learn import KerasRegressor

def baseline_model():
    model = Sequential()
    model.add(Dense(13, input_dim=1, kernel_initializer='normal', activation='relu'))
    model.add(Dense(1, kernel_initializer='normal'))
    # Compile model
    model.compile(loss='mean_squared_error', optimizer='adam',metrics=['accuracy'])
    tensorboard = TensorBoard(log_dir="D:\Graph".format(time()))
    return model
Build a regressor model,
from time import time
tensorboard = TensorBoard(log_dir="D:\Graph".format(time()))
estimator = KerasRegressor(build_fn=baseline_model, epochs=110, batch_size=1,verbose=1, callbacks=[tensorboard])
predict a value,
estimator.predict(np.array([12]))
Score will be,
score = estimator.score(X, Y)
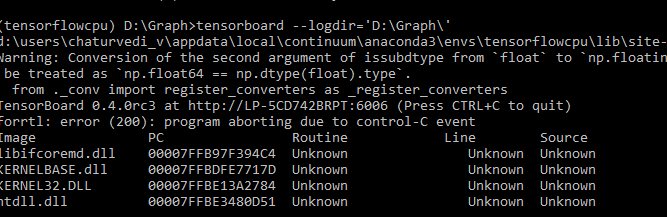
Now, how can we visualize the model ?. Go to tensorboard….
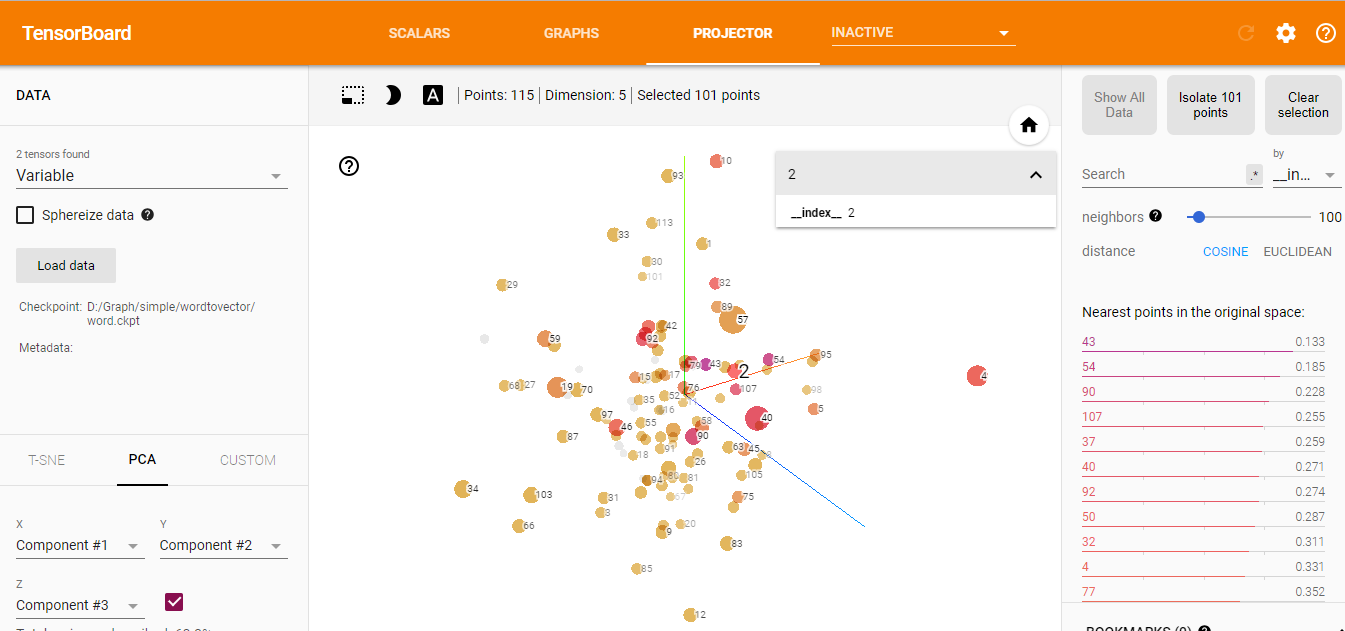
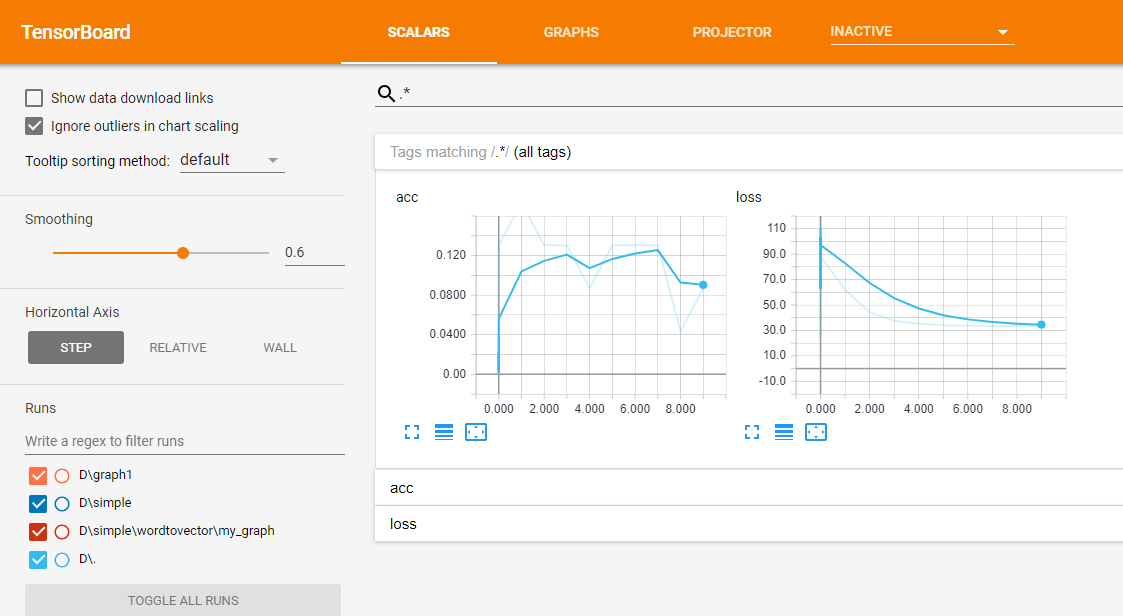
The visualization will be like this,

Nice Articles for tensorflow:
Refer:http://www.godeep.ml/visualize-graphs-training-curves-tensorboard/