Google Cloud Data Engineering
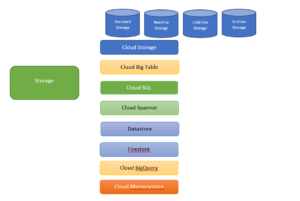
GCP is broadly divided into the following categories Networking Compute Storage Bigdata and ML Products Compute The GCP offers the following compute services. Compute Engine Kubernetes Engine App Engine Cloud Functions Anthos Cloud Run Compute Engine is Google’s infrastructure-as-a-service (IaaS) offering. It is also the building block for other services that run on top of this compute resource. …